Product Feature Usage
Explore the hierarchical usage of product features.
Cash Flow
Visualize company finances as a true flow and simply reporting.
Customer Journey
Build shared understanding of the lifecycle customers move through with metrics and analysis.
Scenario Modeling
Use sliders to make metric trees powerful explorations of possible scenarios.
Metric Tree
Break down revenue as a hierachy of core metrics to clearly see what's driving performance.
Onboarding Flow
Activity and conversion rates of a mobile app onboarding process, with screenshots and each possible user journey.
B2B SaaS Metric Tree
A full B2B Metric Tree.
Product Onboarding Funnel
Visualize an entire product funnel with screenshots and live data to find where you're losing users and why
B2C Growth Model
Map out your growth model with live data.
Every Visual Under the Sun
A selection of the visualizations that are possible with Count.
Data Transformation
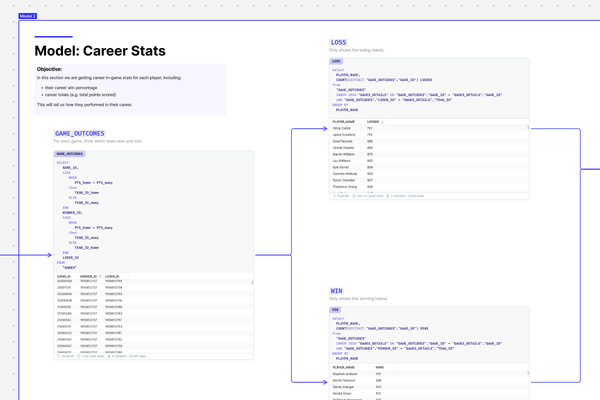
Turning some messy tables of basketball data into a clean, robust data-model.
Data Exploration
Break down a data request into a logical structure and present back the answer alongside the methodology to provide perfect clarity.
A/B Test
Run a full A/B test within one canvas, including the scope of the experiment, design and then the results, including statistical significance.
Client Quarterly Review
Build out a customer success presentation for client including live data of their product usage.
Dashboard
Weekly performance overview of an e-commerce business including commentary, metric definitions and comments.
The Ultimate Guide to dbt
Everything you could ever know about dbt, all in one canvas.
The Ultimate Guide to Hiring your Data Team
Every useful resource in the data community about hiring people to join your data team, all in one canvas.
The Ultimate SQL Guide
An interactive tutorial for learning or brushing up on your SQL skills.