Because the world needed more charts
Run a full A/B test within one canvas, including the scope of the experiment, design and then the results, including statistical significance.
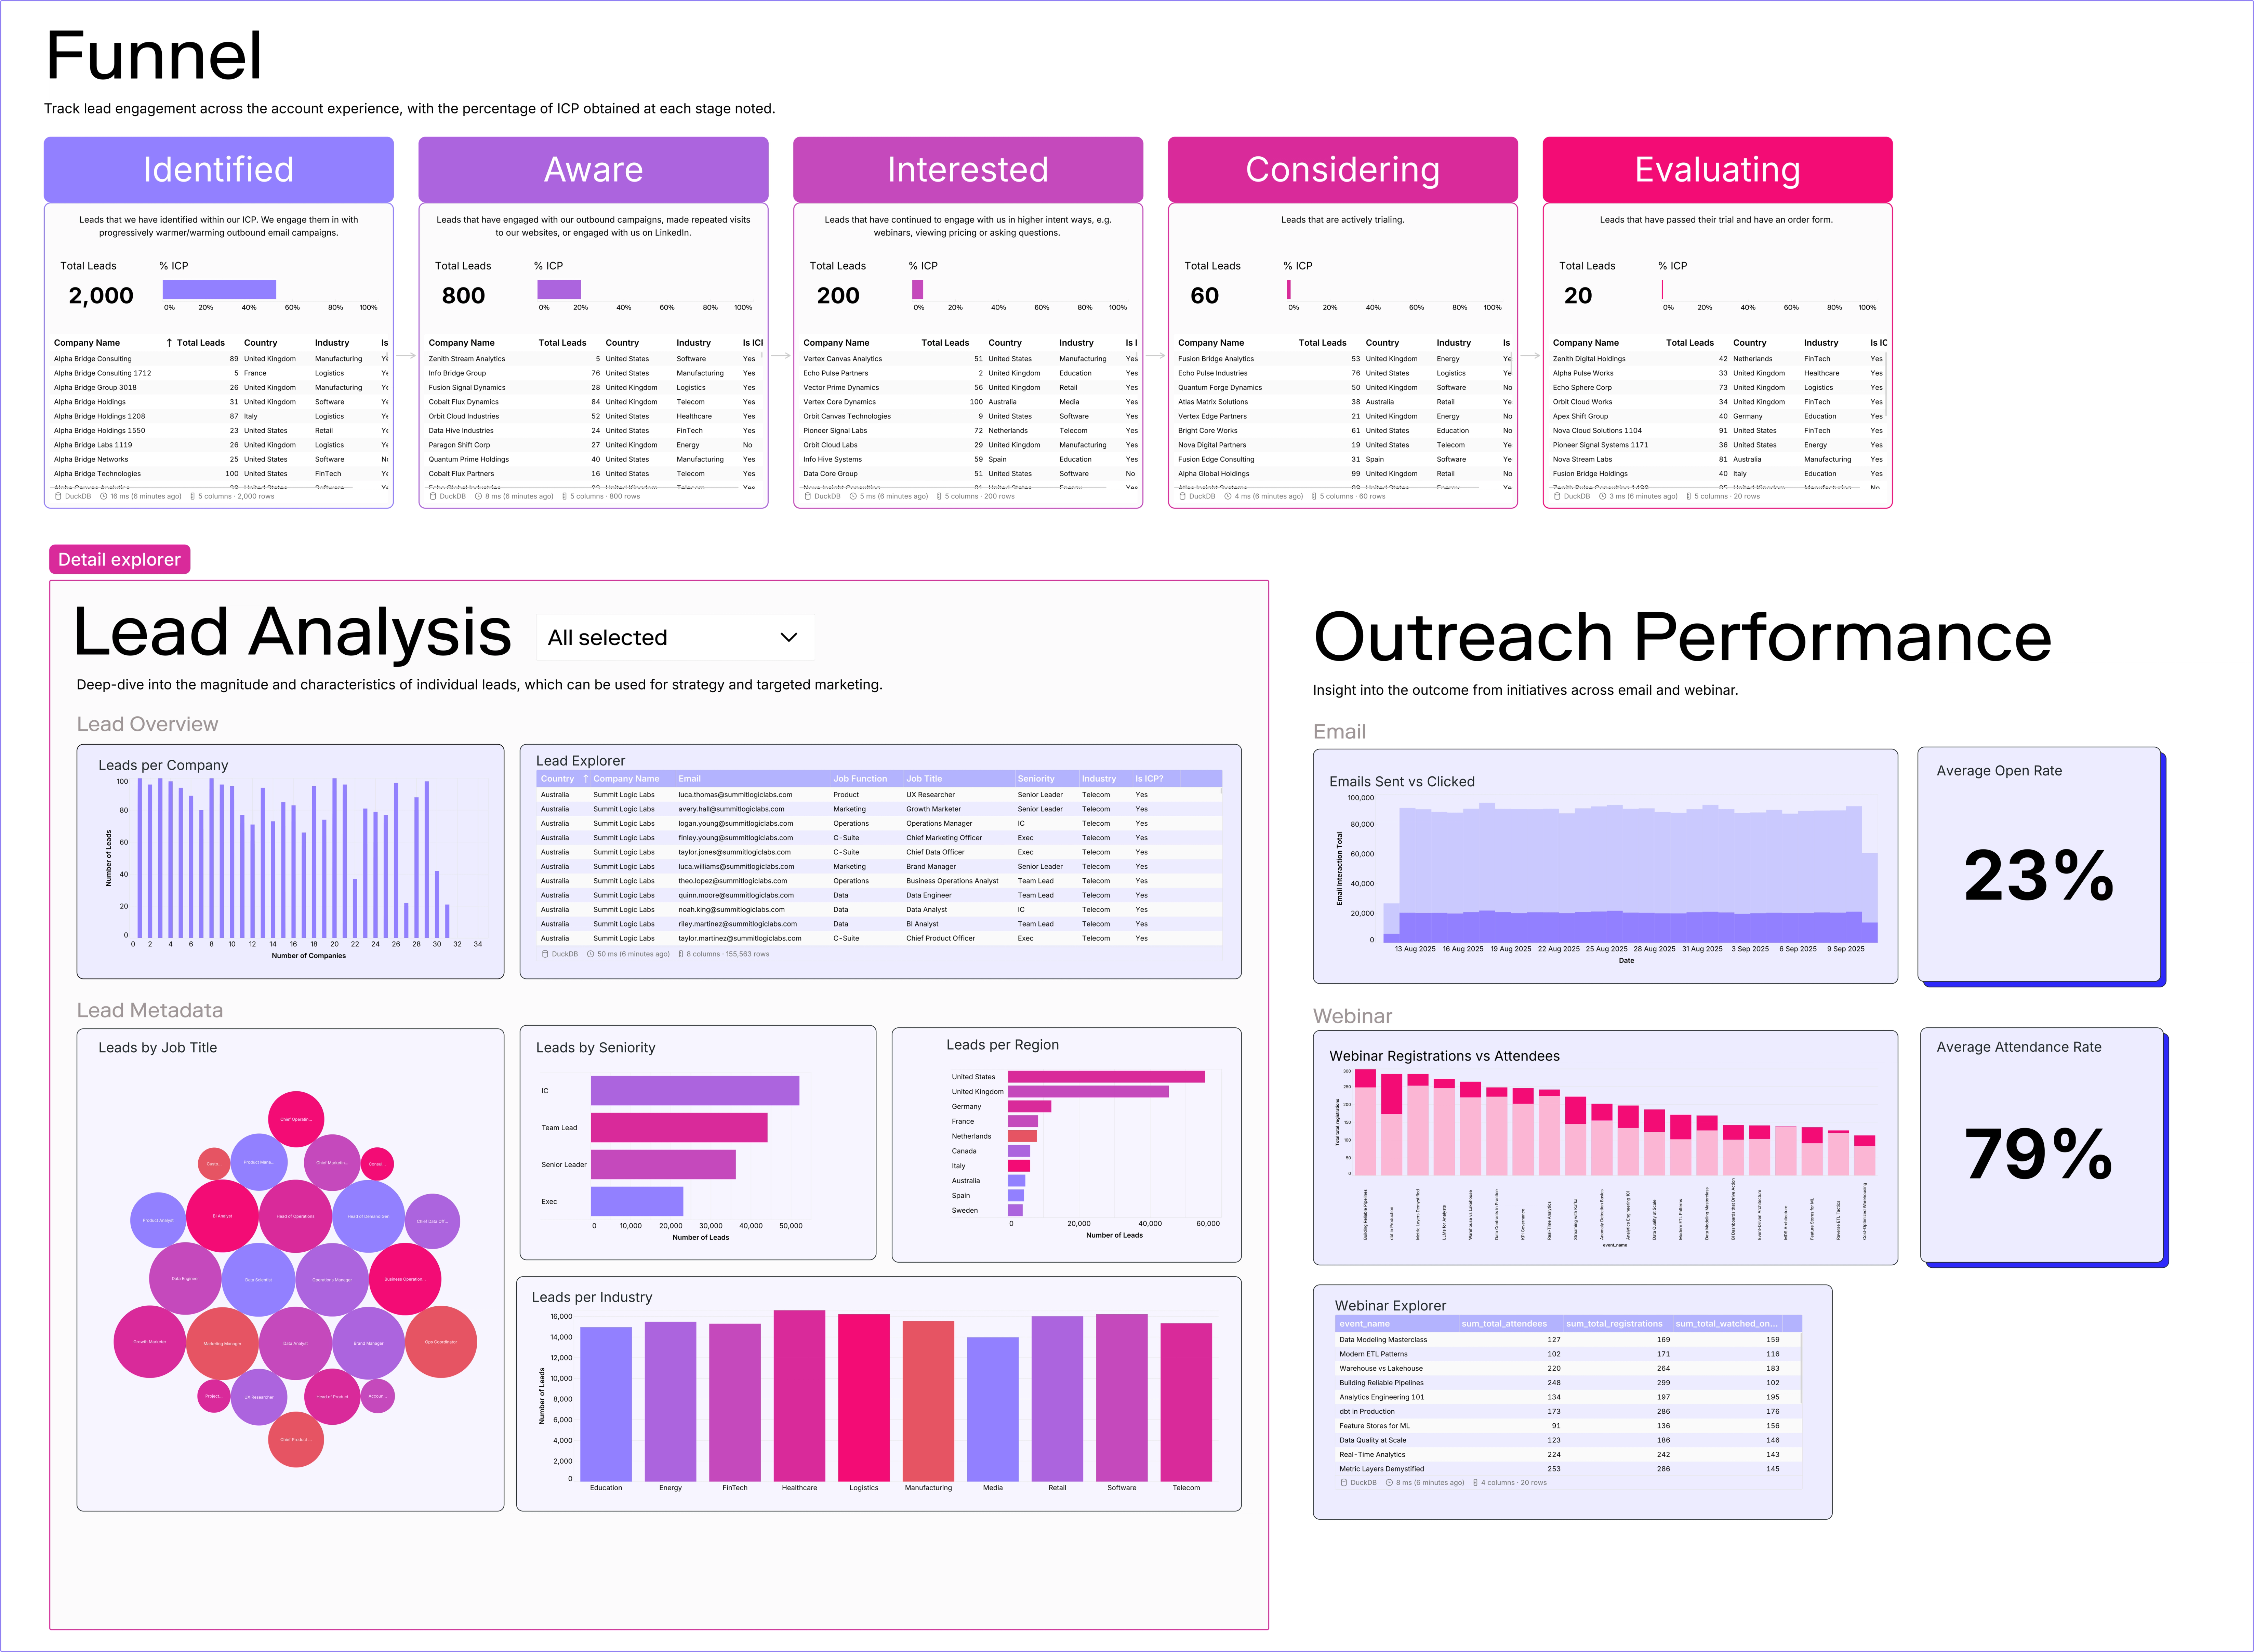
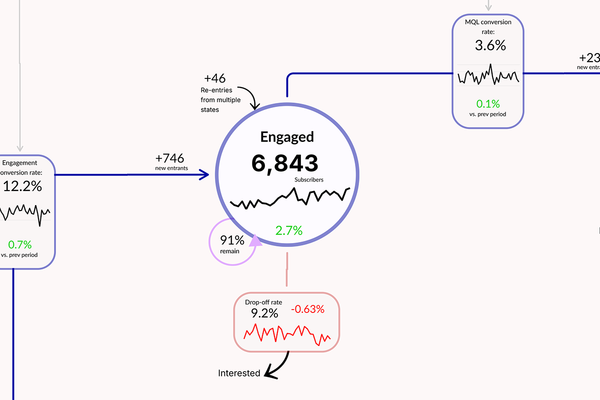
Bring visibility to your marketing strategy and clarity to your next steps by showing how lead activity drives your funnel
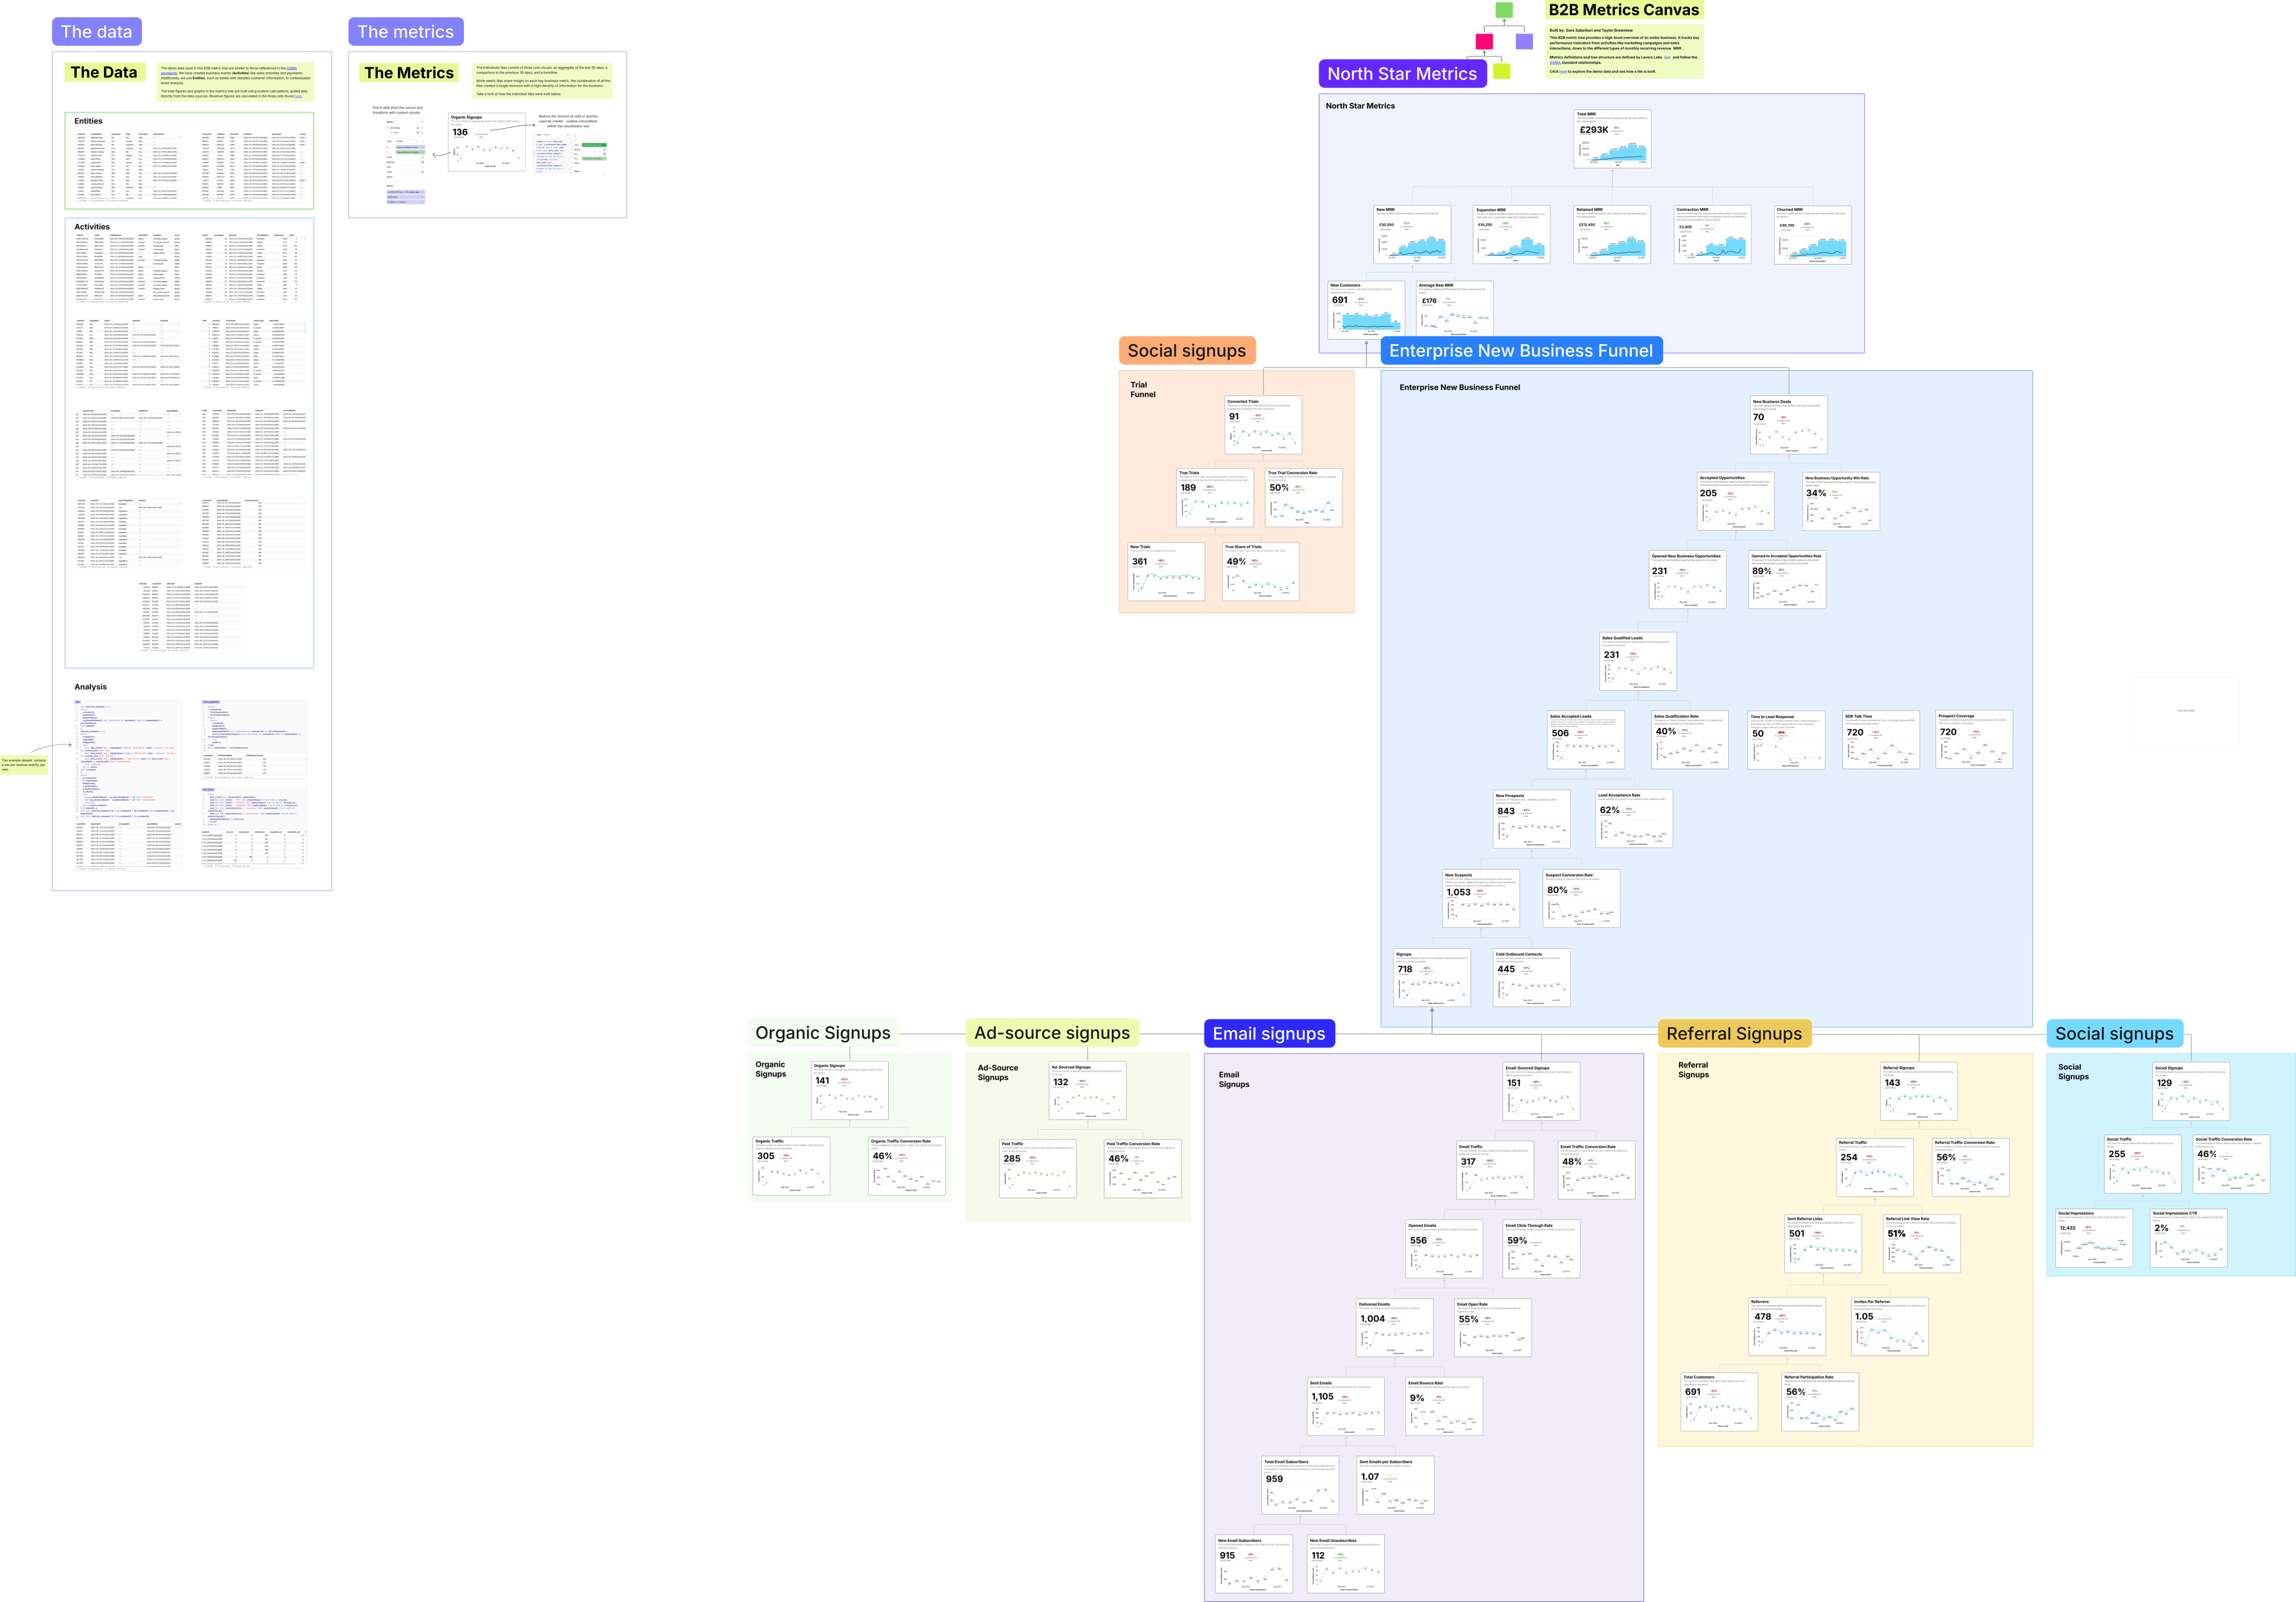
A full B2B Metric Tree.
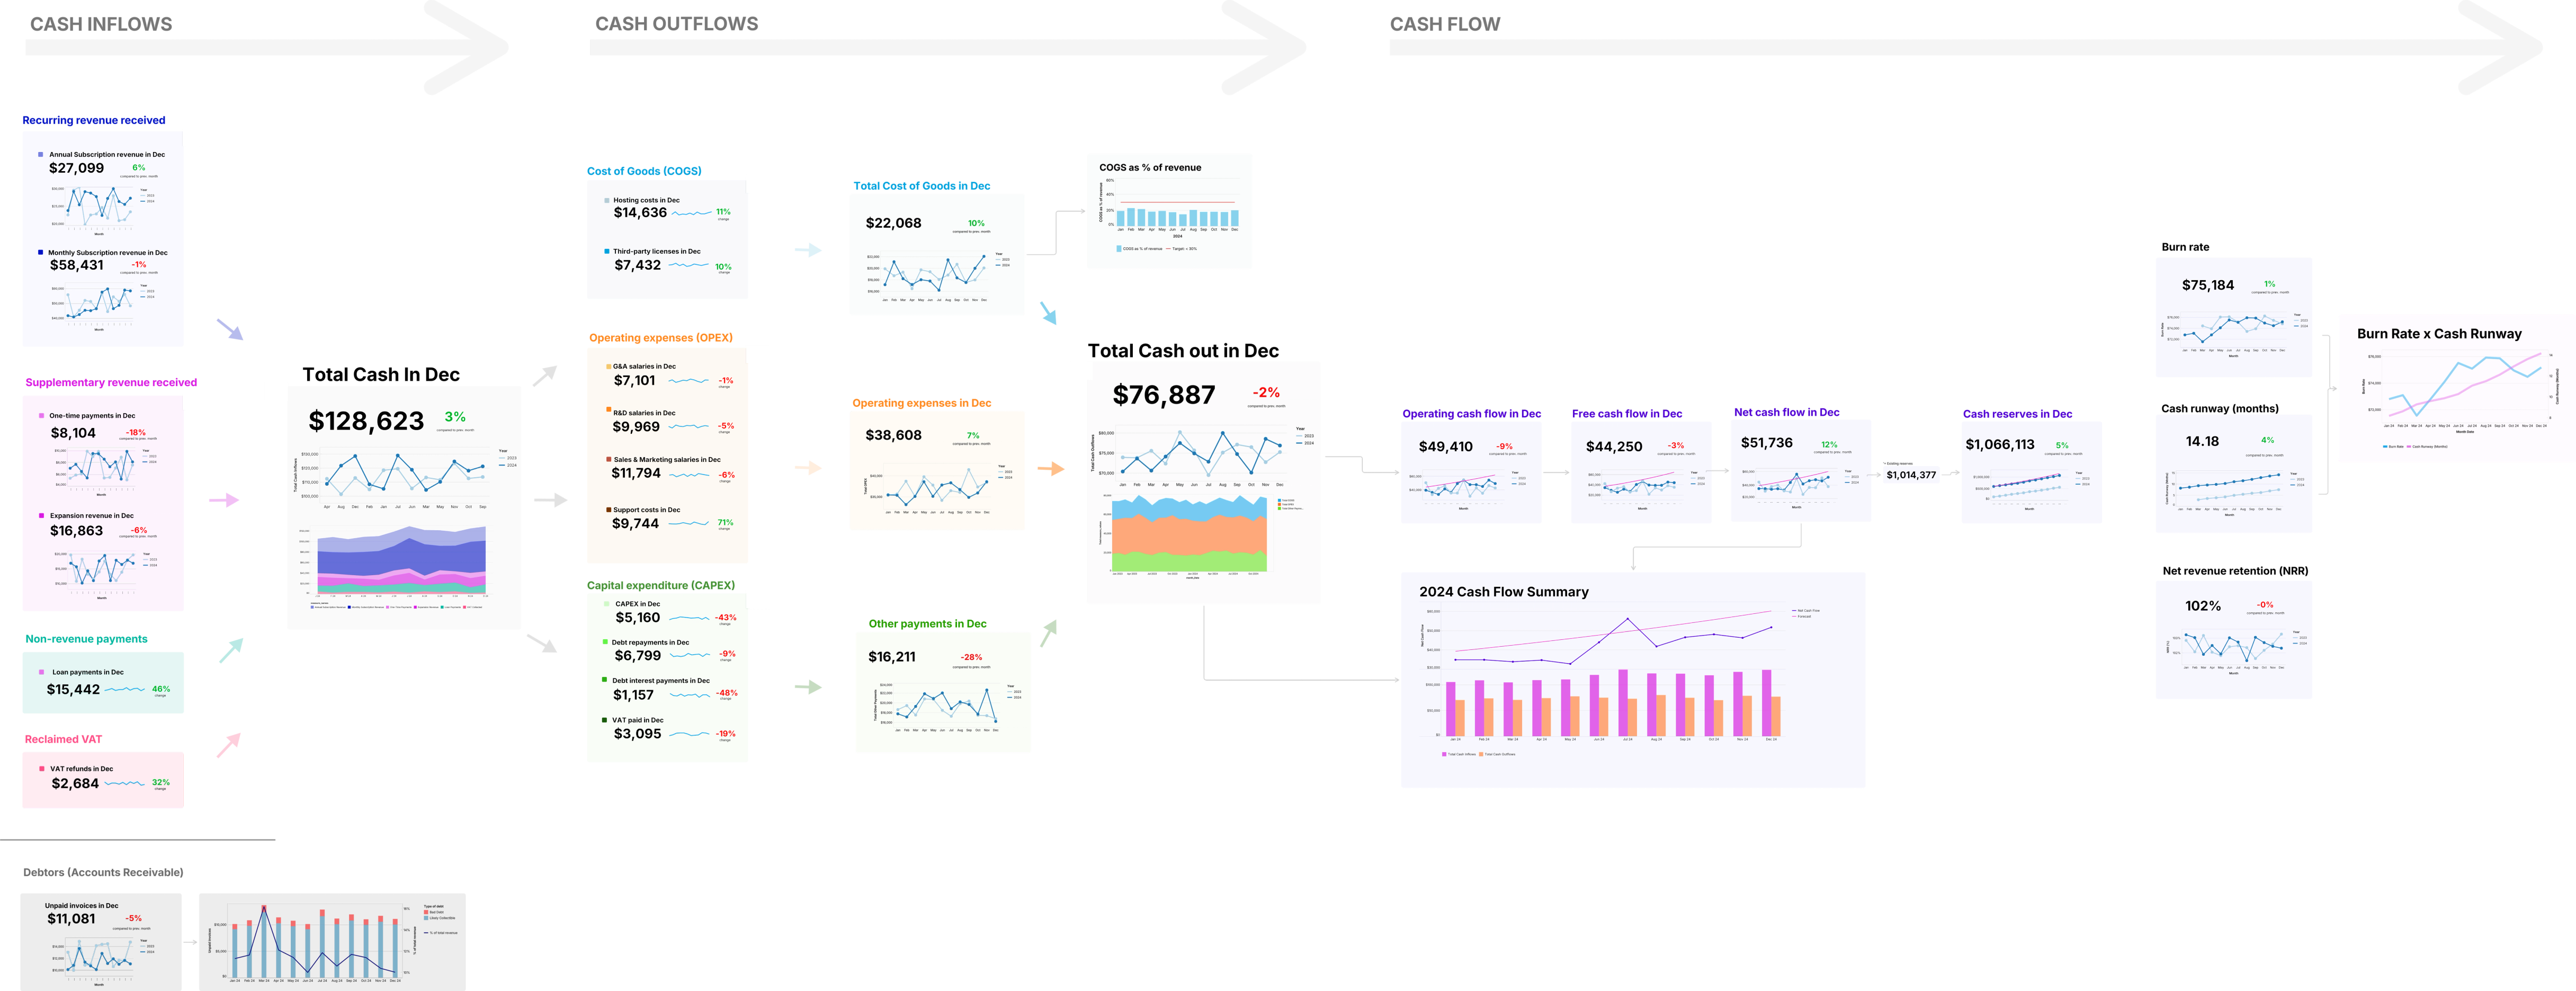
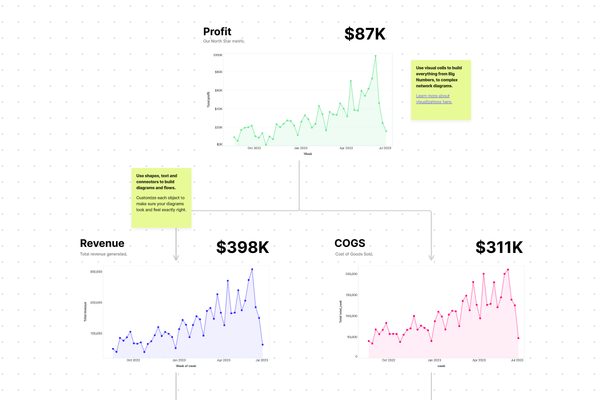
Visualize company finances as a true flow and simplify reporting.
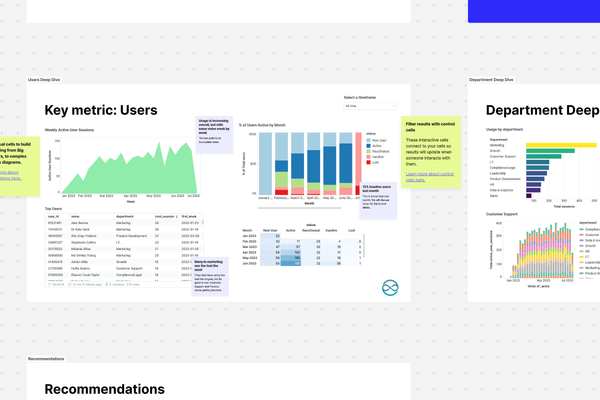
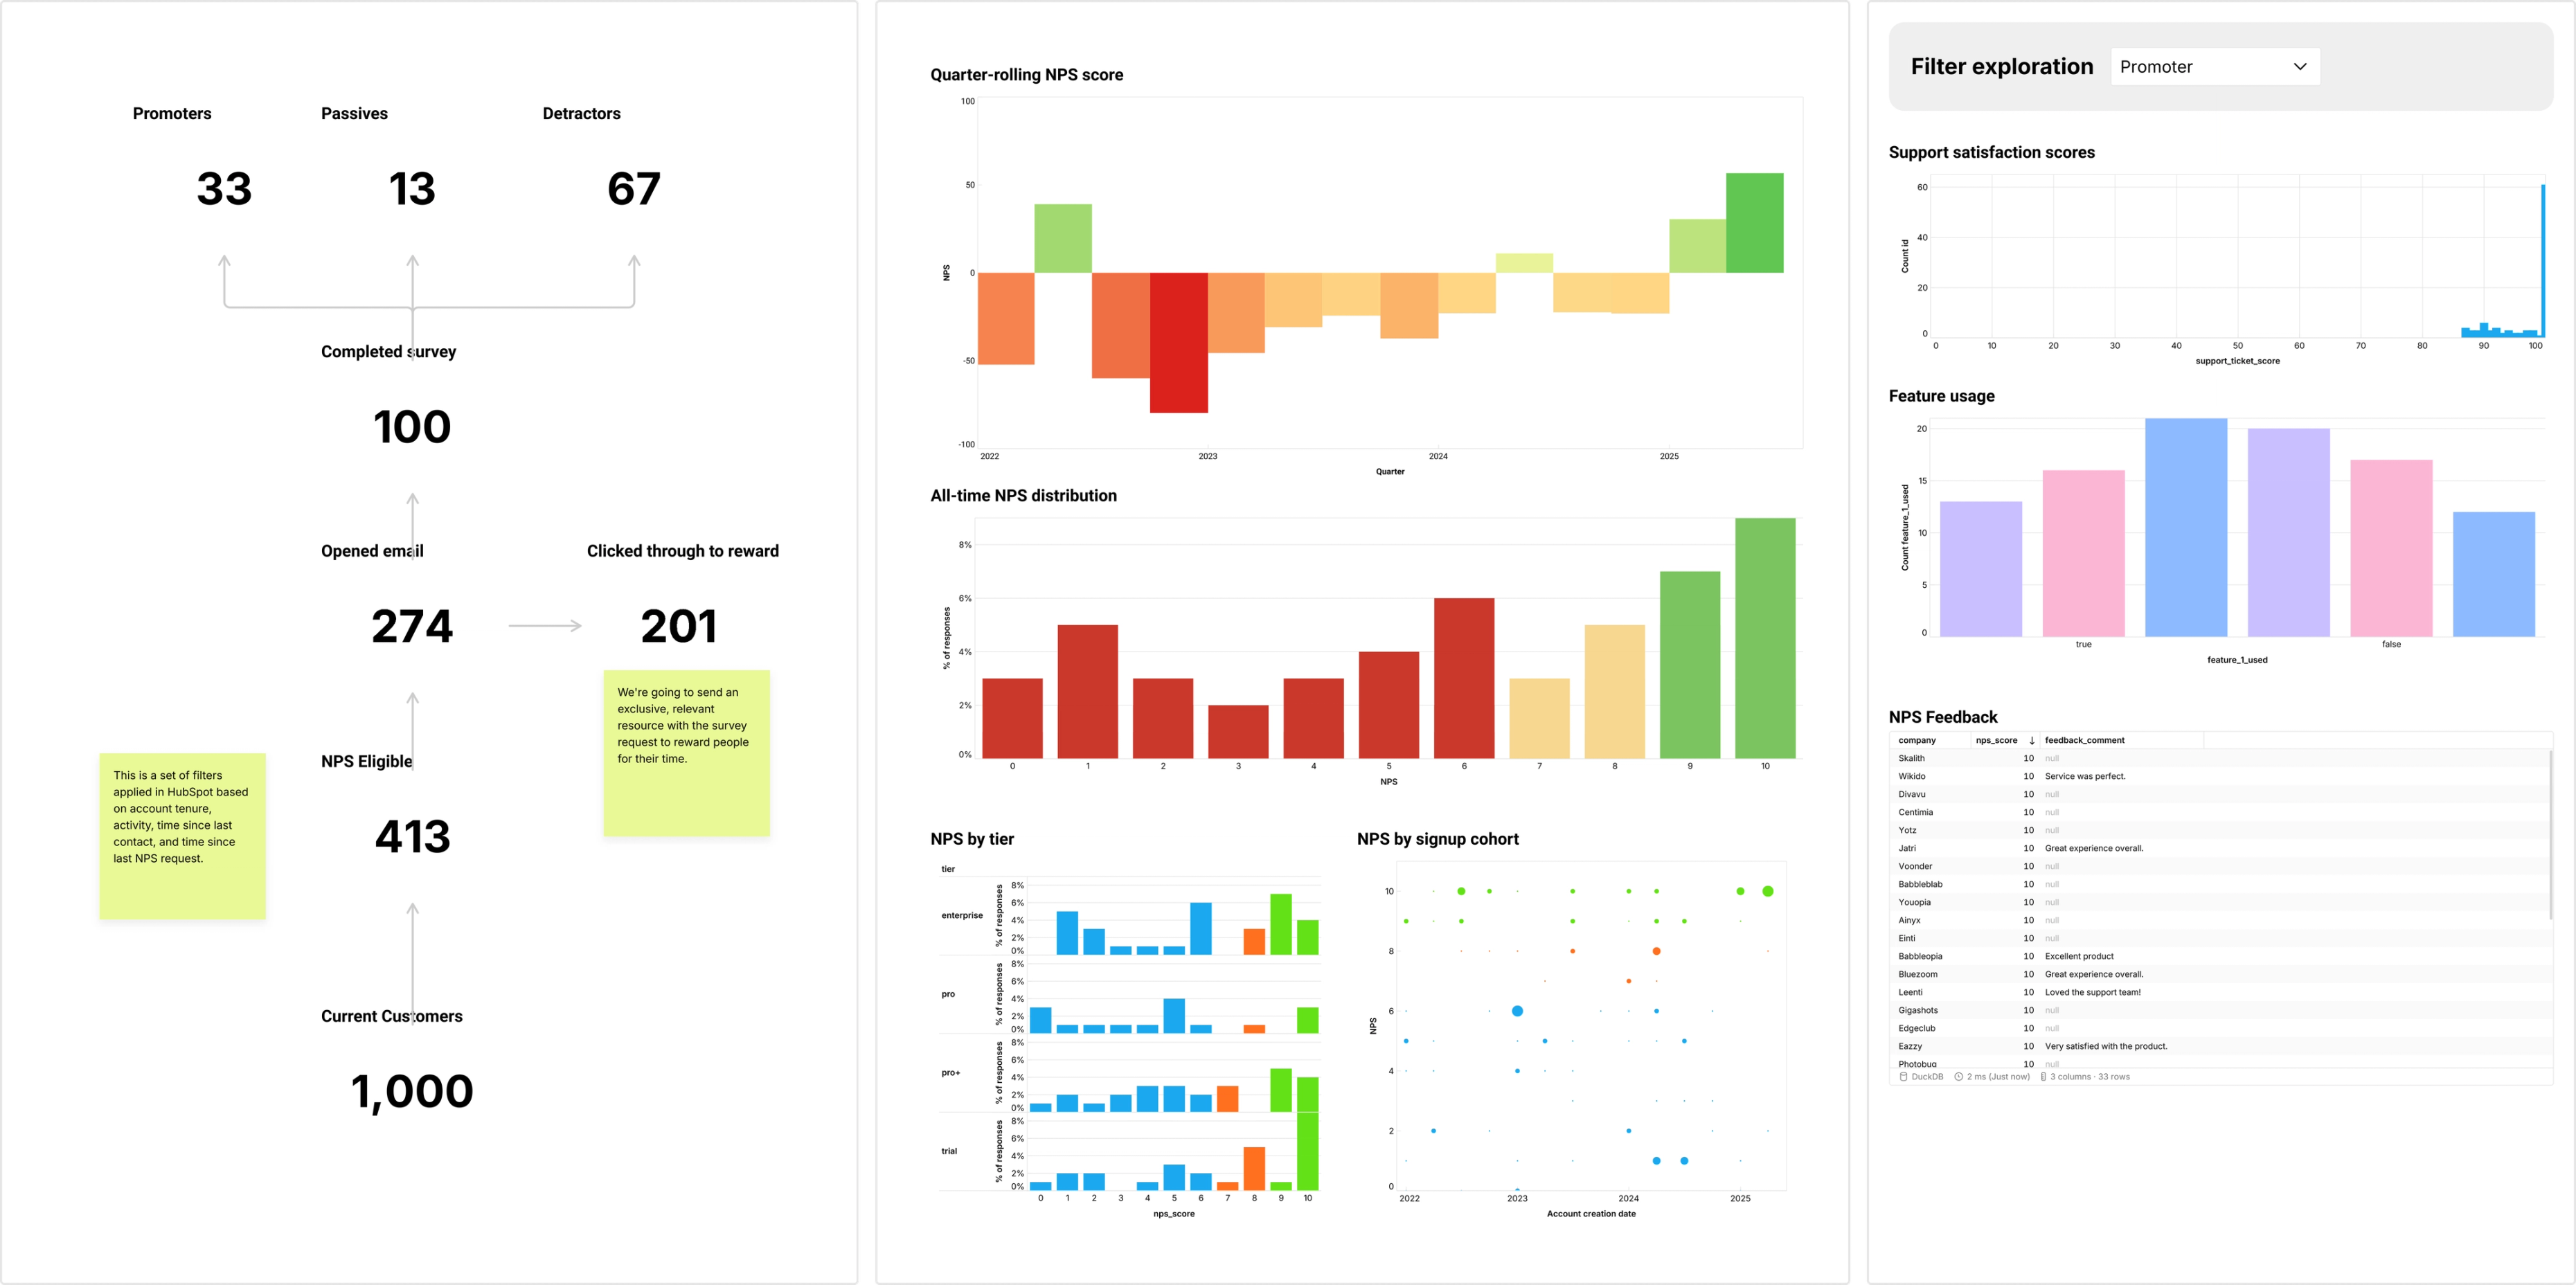
Build out a customer success presentation for client including live data of their product usage.
Build a shared understanding of the lifecycle customers move through with metrics and analysis.
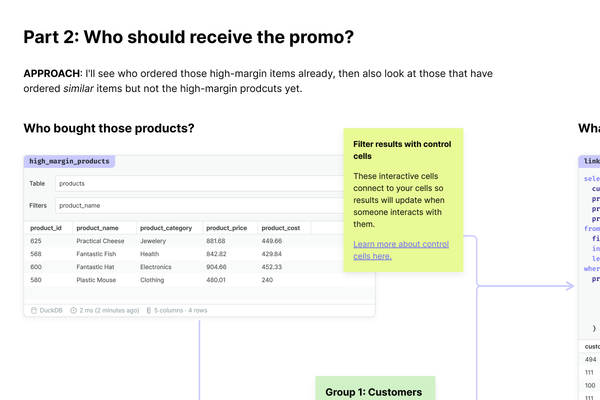
Break down a data request into a logical structure and present back the answer alongside the methodology to provide perfect clarity.
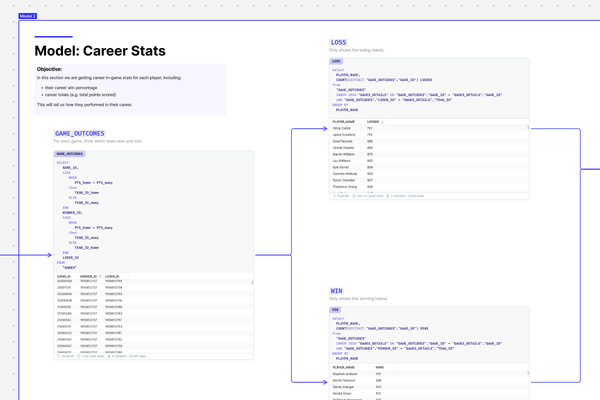
Turning some messy tables of basketball data into a clean, robust data-model.
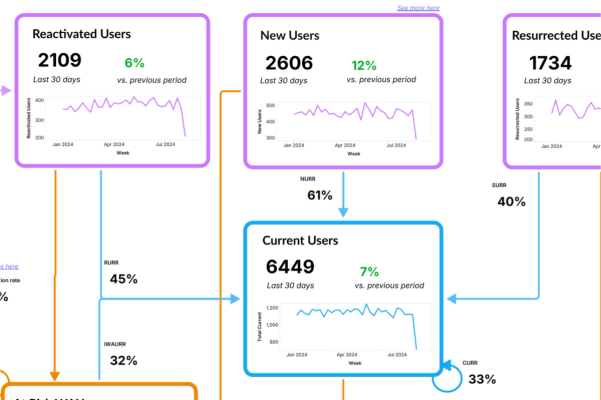
Map out your B2C company's growth model with live data in this canvas inspired by Duolingo.
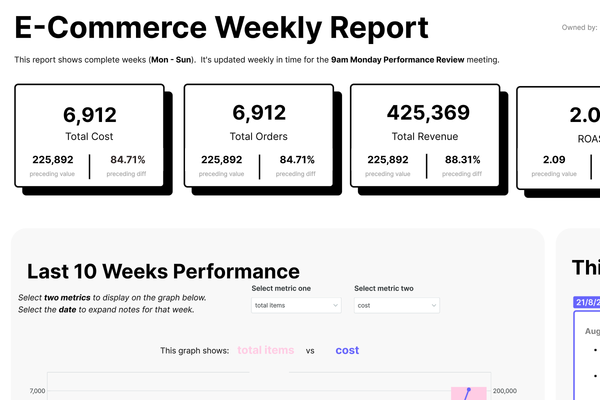
Weekly performance overview of an ecommerce business, including commentary, metric definitions, and comments.
A selection of the visualizations that are possible with Count.
Unified finance canvas to track ARR, deals, and payments in one place to monitor, prevent issues, and enable decisions.
A metric map of your GA4 data to show how your website activity impacts your overall business goals.
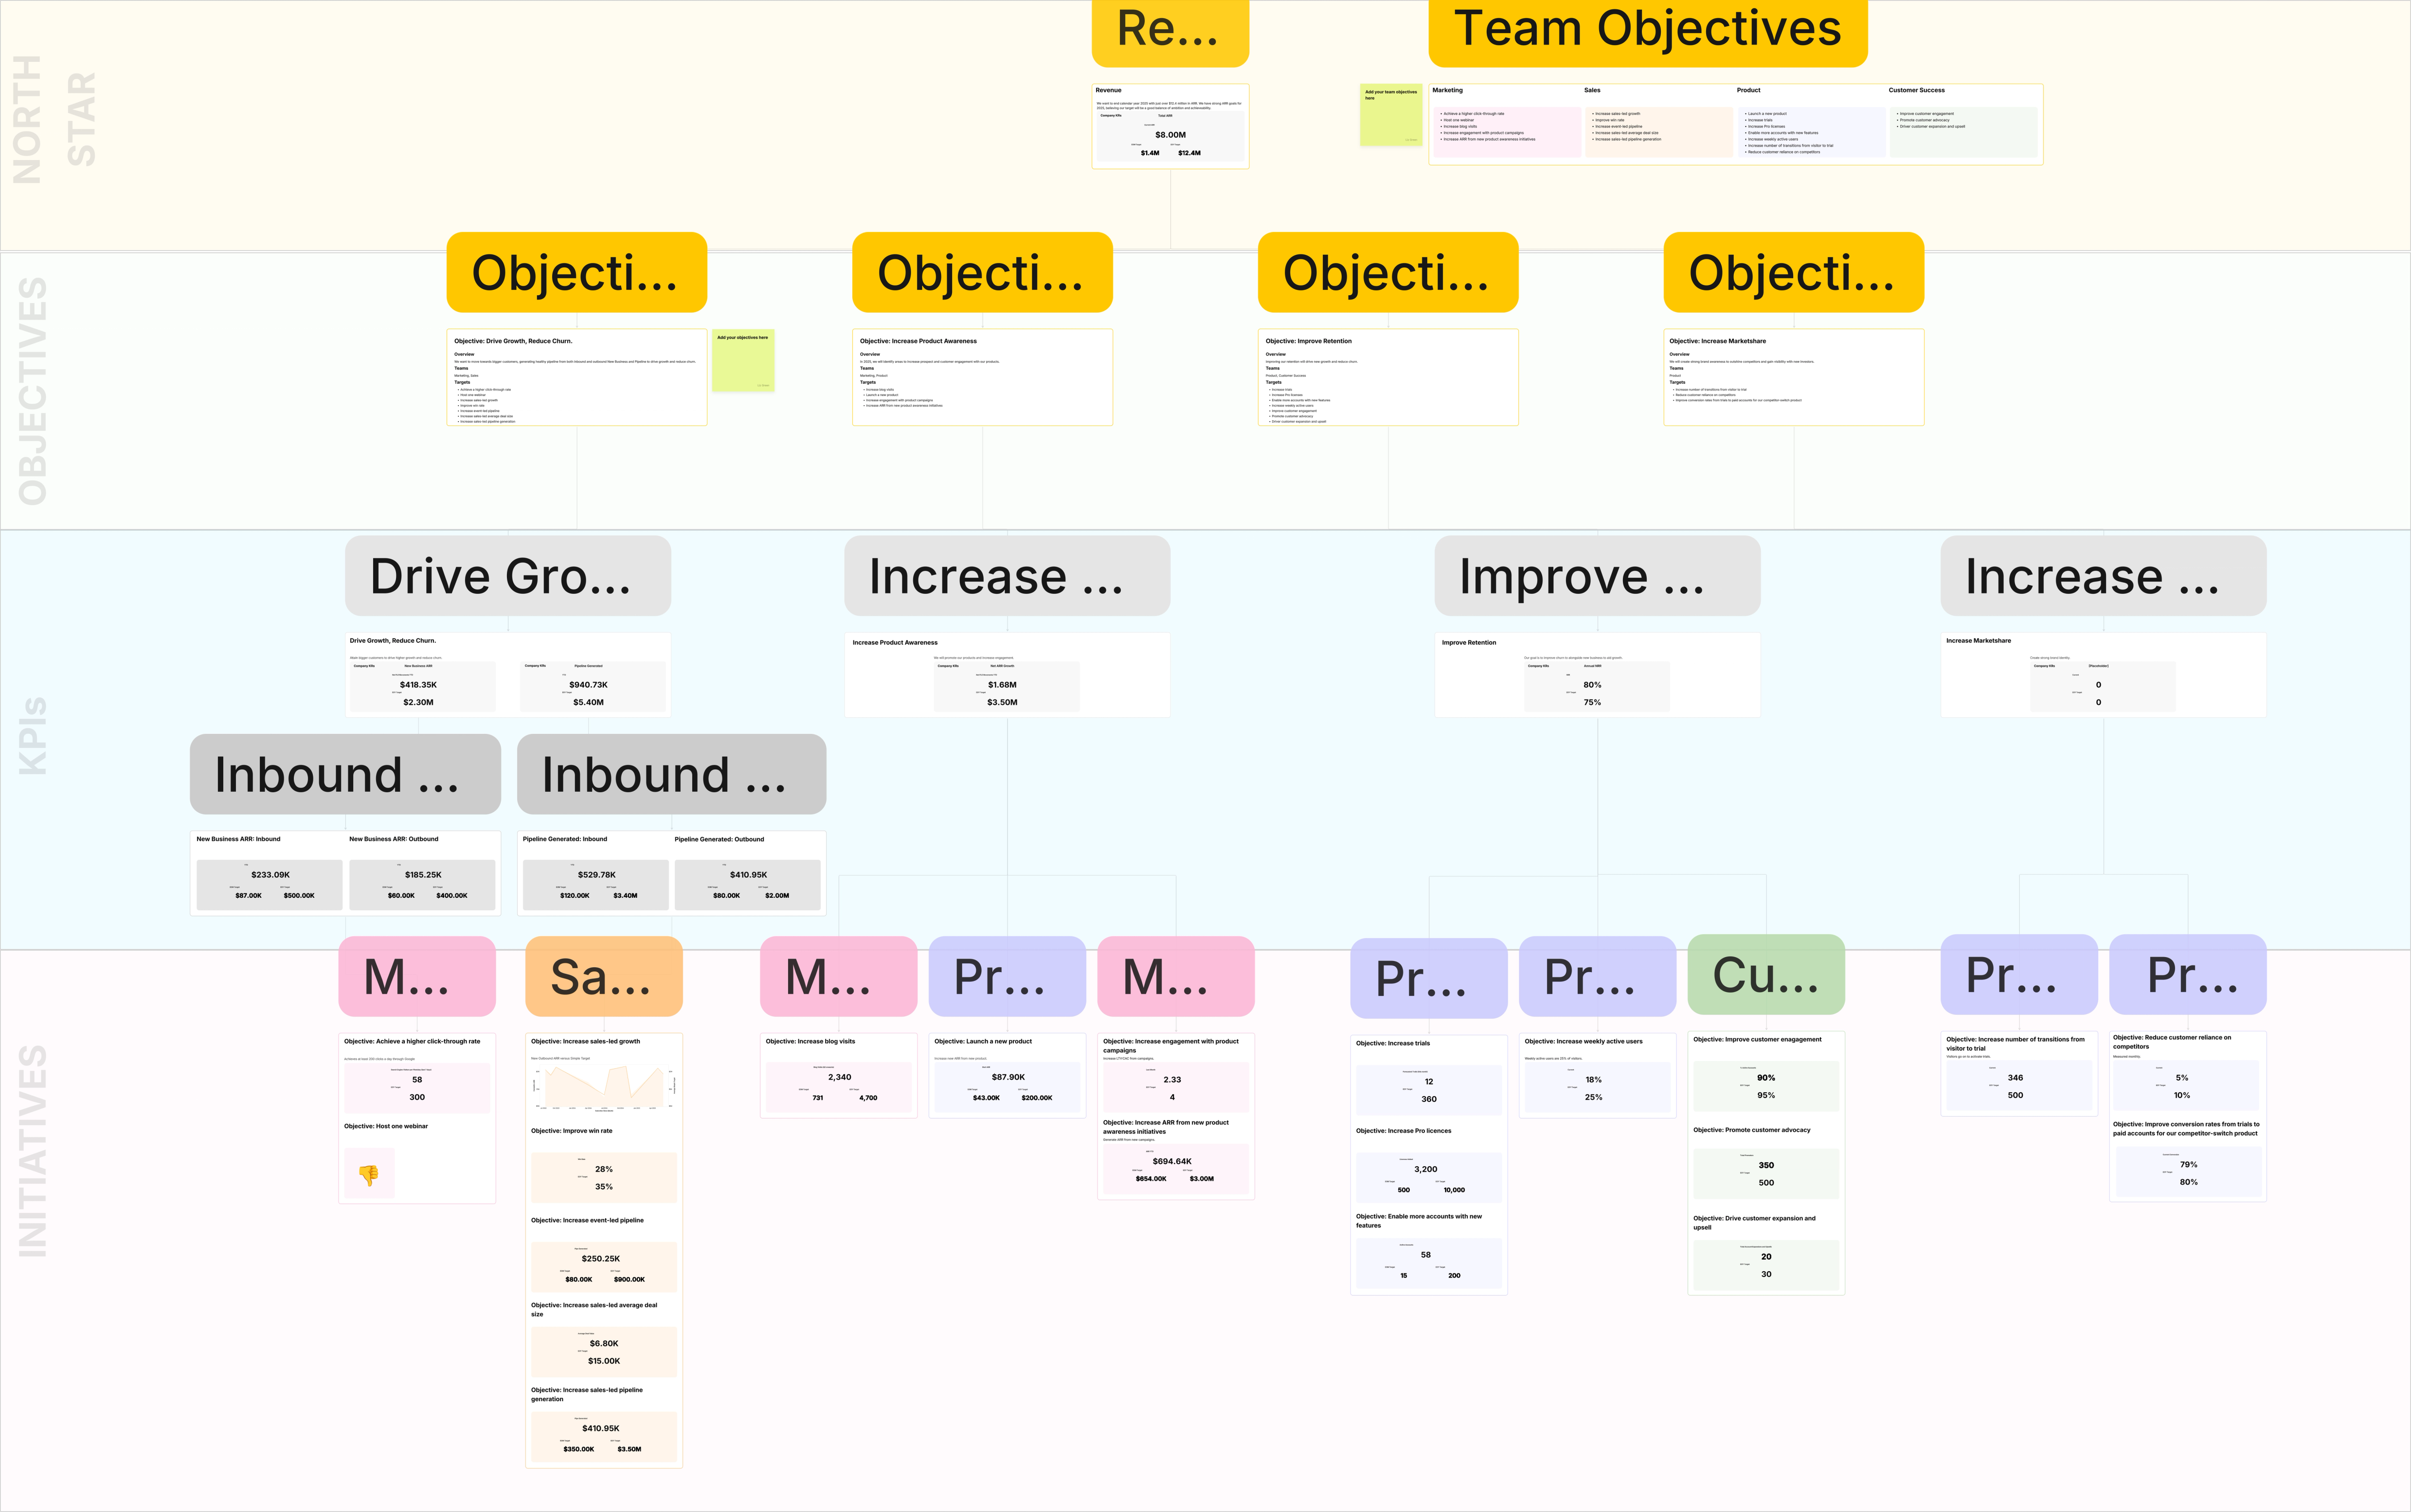
See how Intruder tracks and collaborates on company-wide OKRs to get all teams pulling in the same direction.
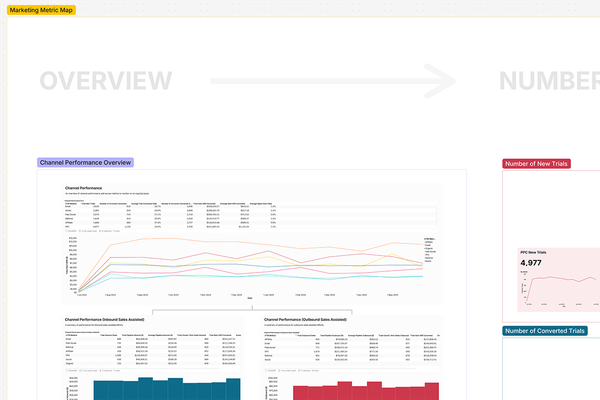
See how Intruder brought key marketing metrics into a single canvas to showcase the real go-to-market performance story.
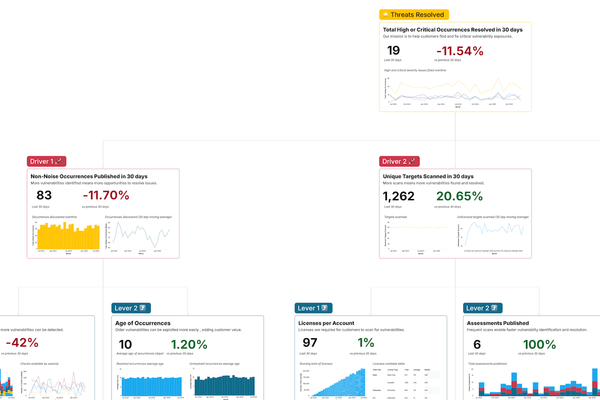
See how Intruder maps product metrics into a tree that helps drive more customer value and align with overall business goals.
Bring all your data together in a single view to serve better customer insight to all of your teams.
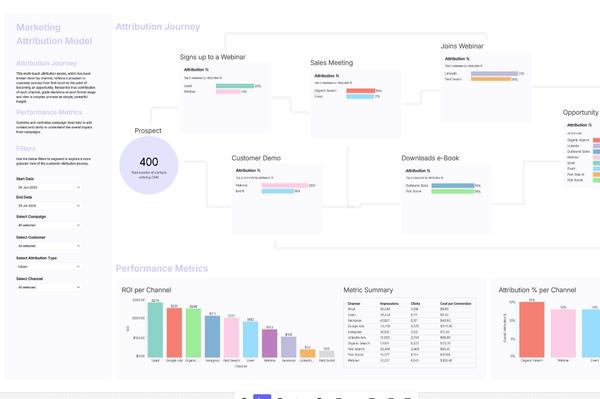
Uncover the real impact of each channel, inform decisions at every stage of the funnel, and turn complex journeys into simple, actionable insights with our multi-touch attribution model.
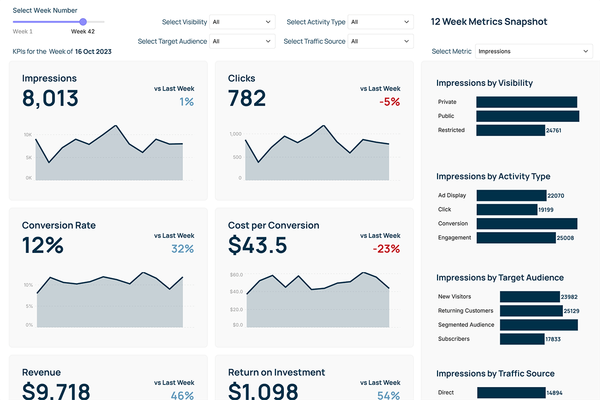
Monitor your marketing campaign performance with this traditional dashboard canvas.
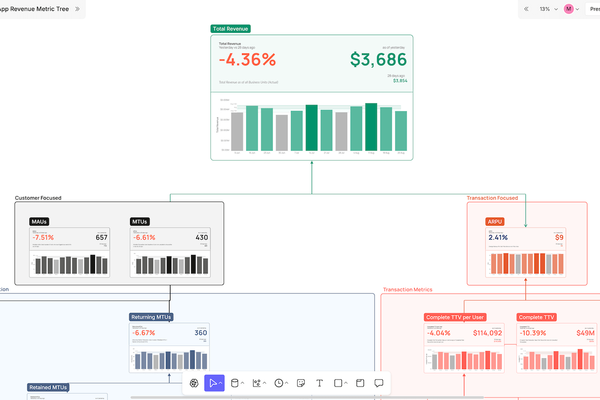
Break down revenue as a hierachy of core metrics to clearly see what's driving performance.
Break down revenue into its key components for a B2C app or platform. Inspired by MoonPay, a consumer-facing crypto exchange app.
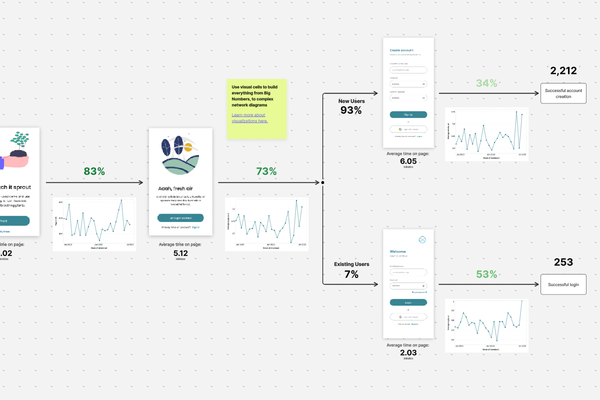
Activity and conversion rates of a mobile app onboarding process, with screenshots and each possible user journey.
Map out how four "stream teams", or smaller product teams, can own core metrics that ladder up to an organization-level North Star.
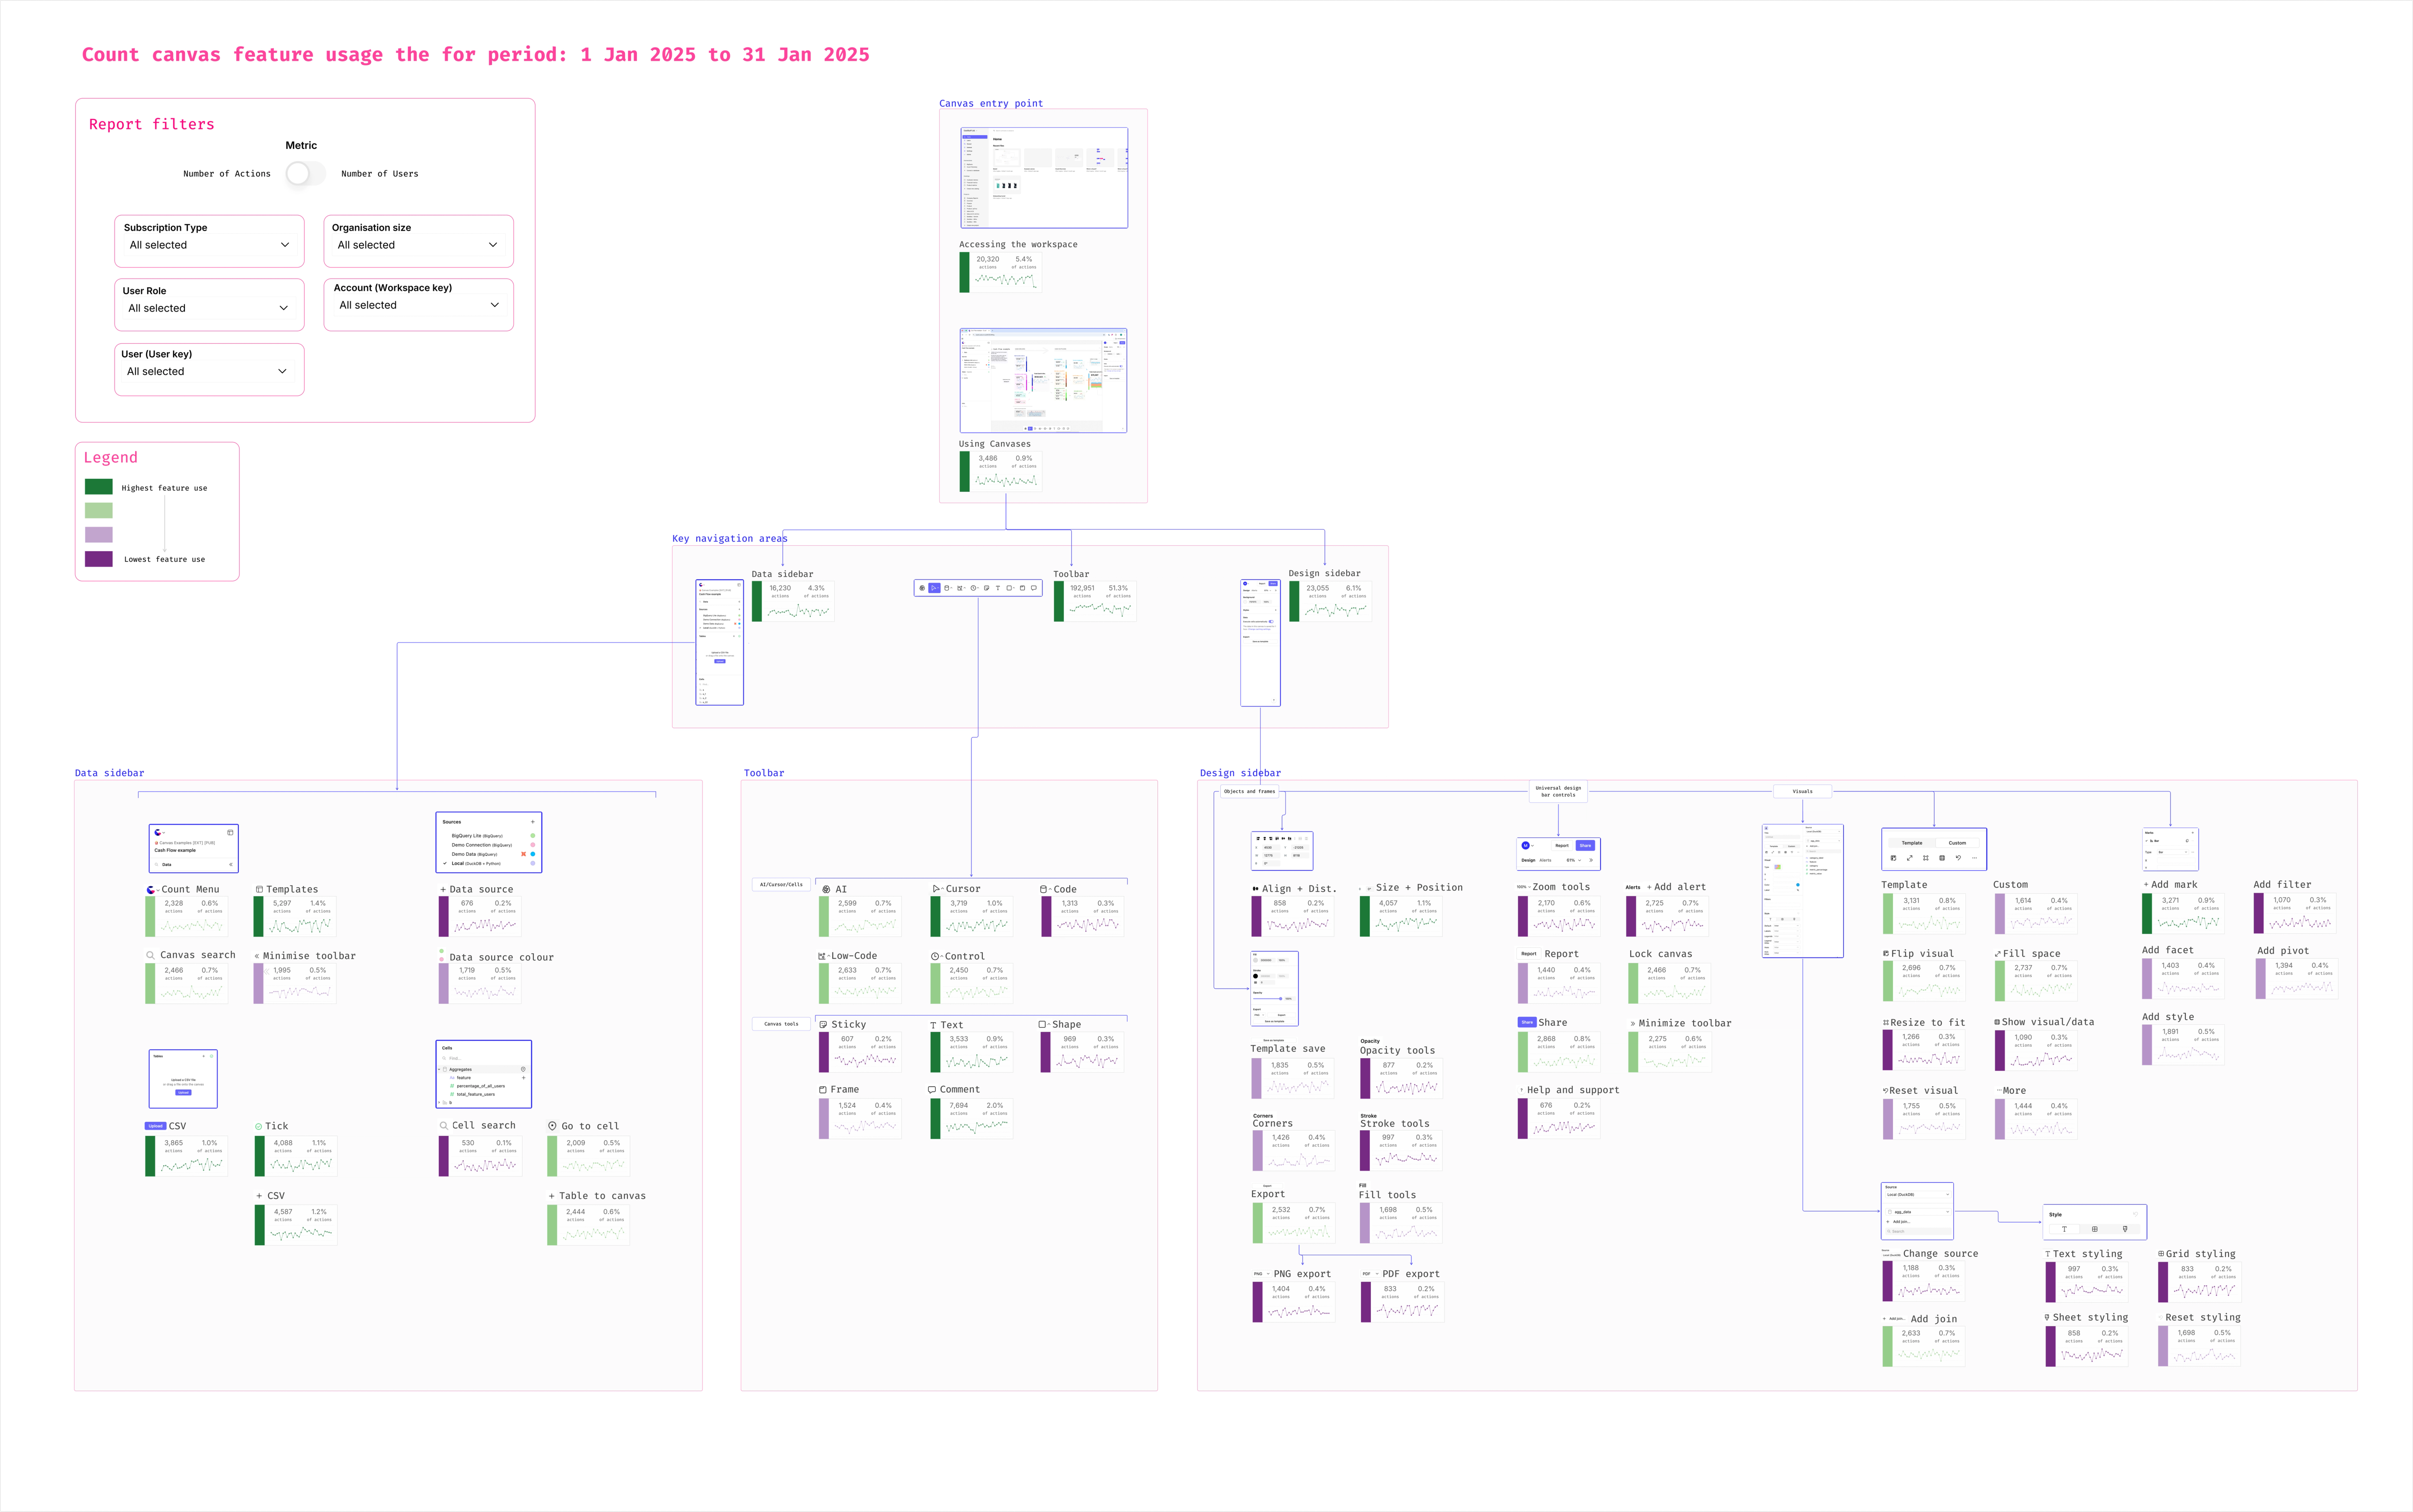
Map your product features into a hierarchical format to explore usage and pinpoint opportunities to improve usability and adoption.
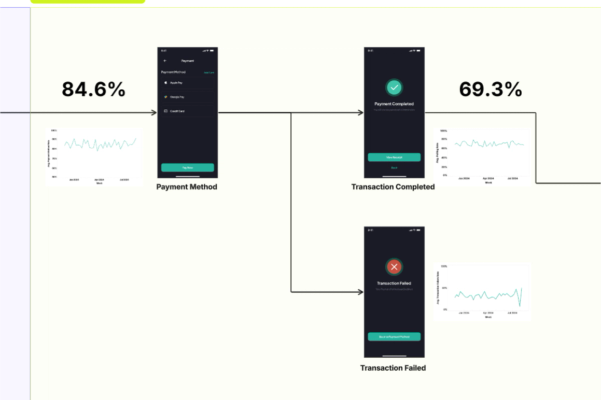
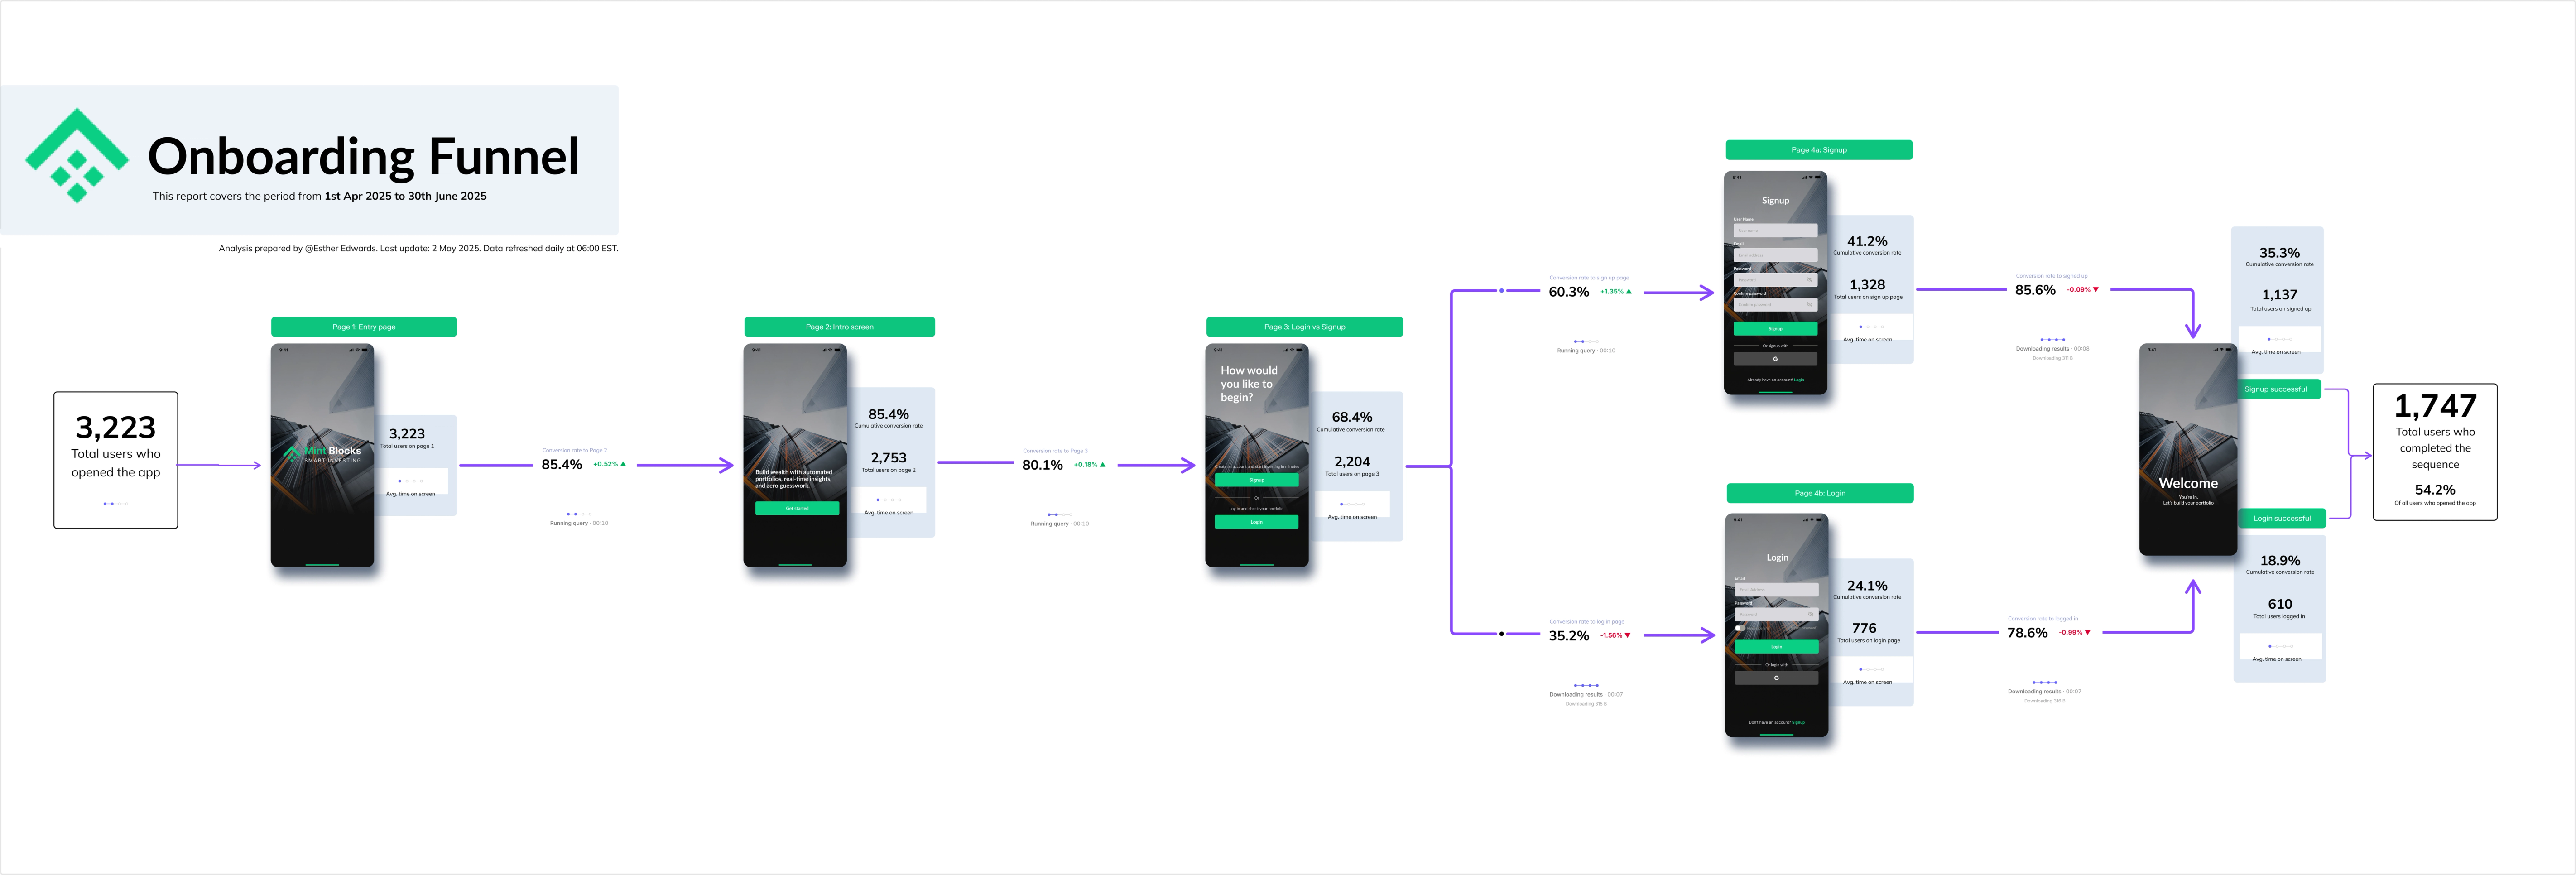
Visualize an entire product funnel with screenshots and live data to find where you're losing users and why
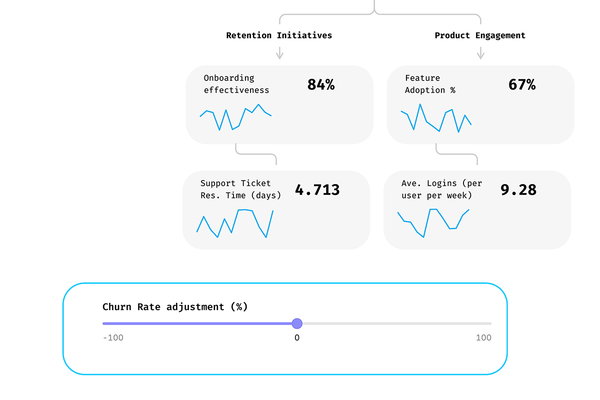
Use predictive sliders in a metric tree to quickly visualize the impact of different scenarios on business outcomes.
A simple flow to track your app or software product's onboarding journey through visual screenshots and conversion data.
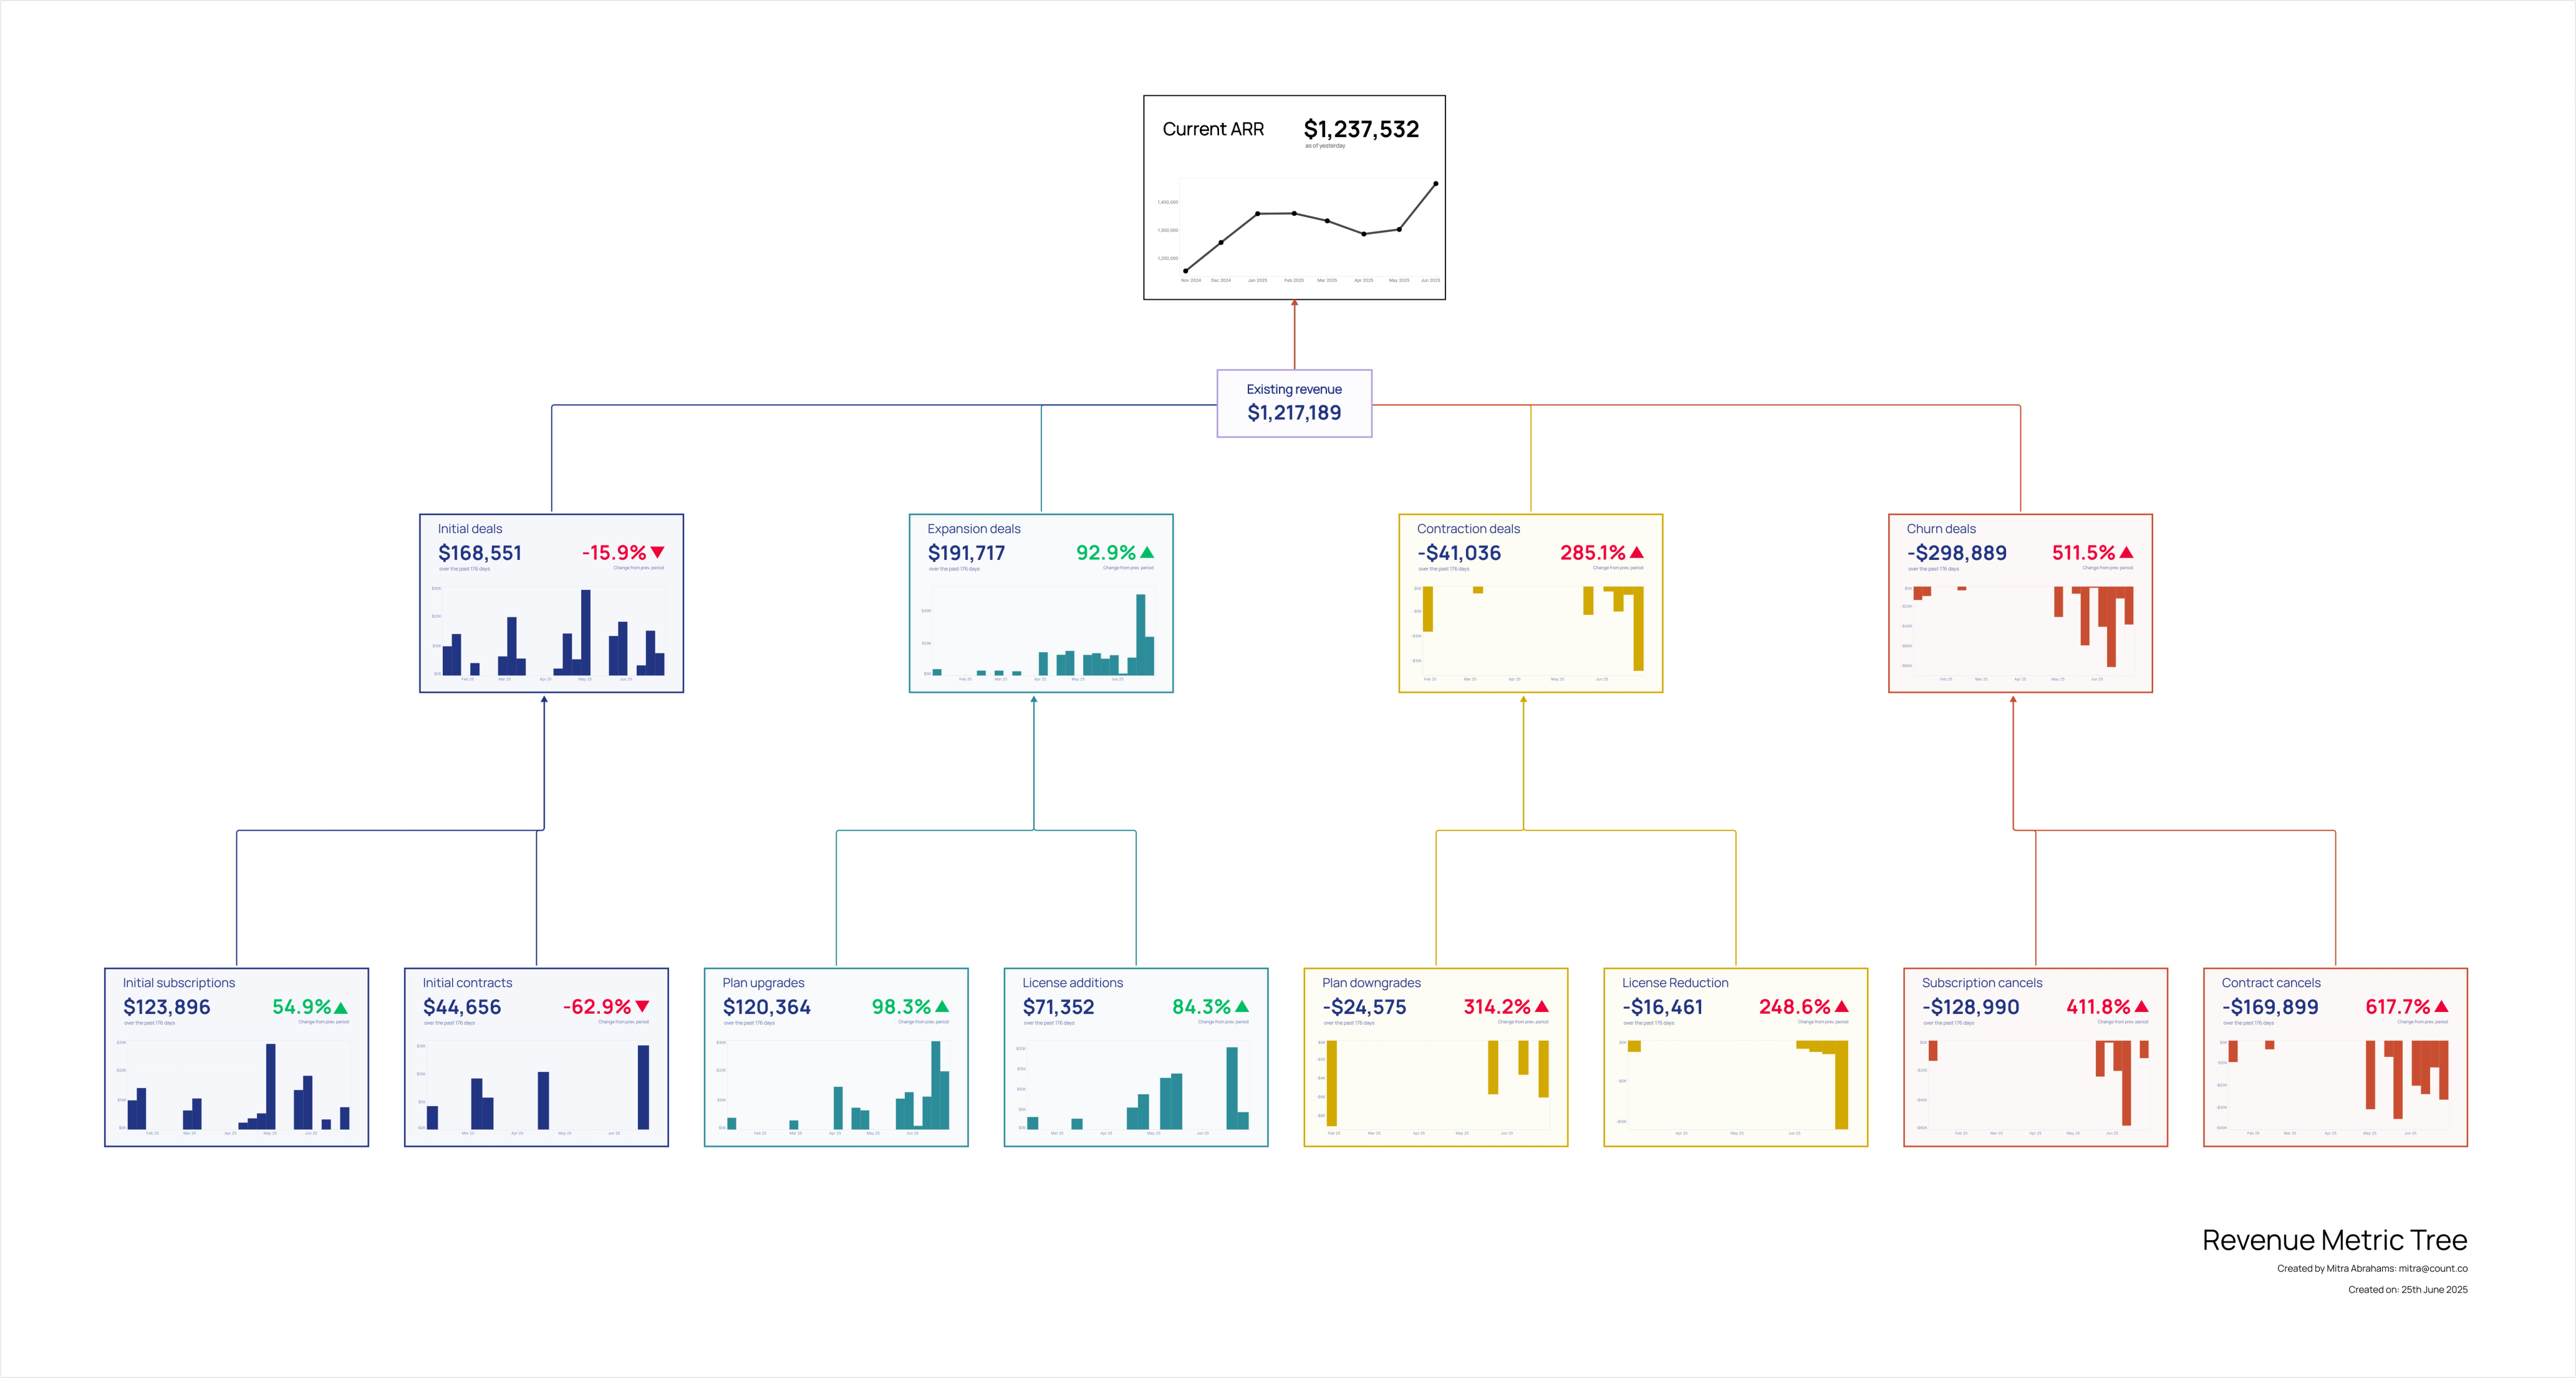
A simple metric tree breaking down revenue into typical B2B SaaS components of new business, expansion, contraction, and churn.
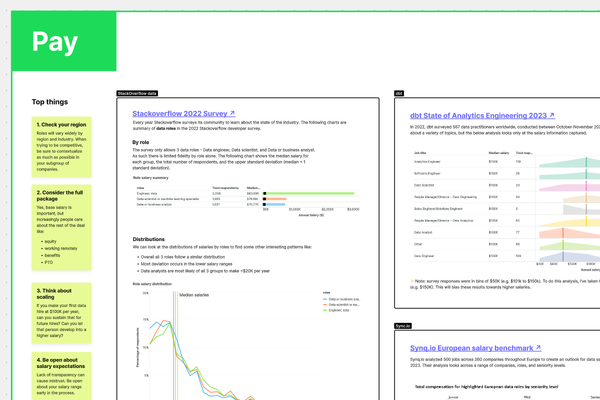
Every useful resource in the data community about hiring people to join your data team, all in one canvas.
Everything you could ever know about dbt, all in one canvas.
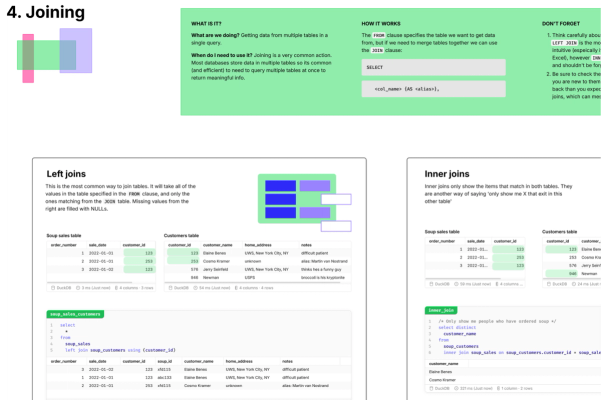
An interactive tutorial for learning or brushing up on your SQL skills.


Gallery
Because the world needed more charts